
Debugging is one of the key feature for any developer. To solve and test issue in the code developers uses the debug feature in general. Azure data factory also provide the debugging feature. In this tutorial I will take you through each and every minute details which would help you to understand the debug azure data factory pipeline feature and how you can utilize the same in your day to day work.
When you go to the data pipeline tab there on the top you can see the ‘Debug’ link to click. Like this :
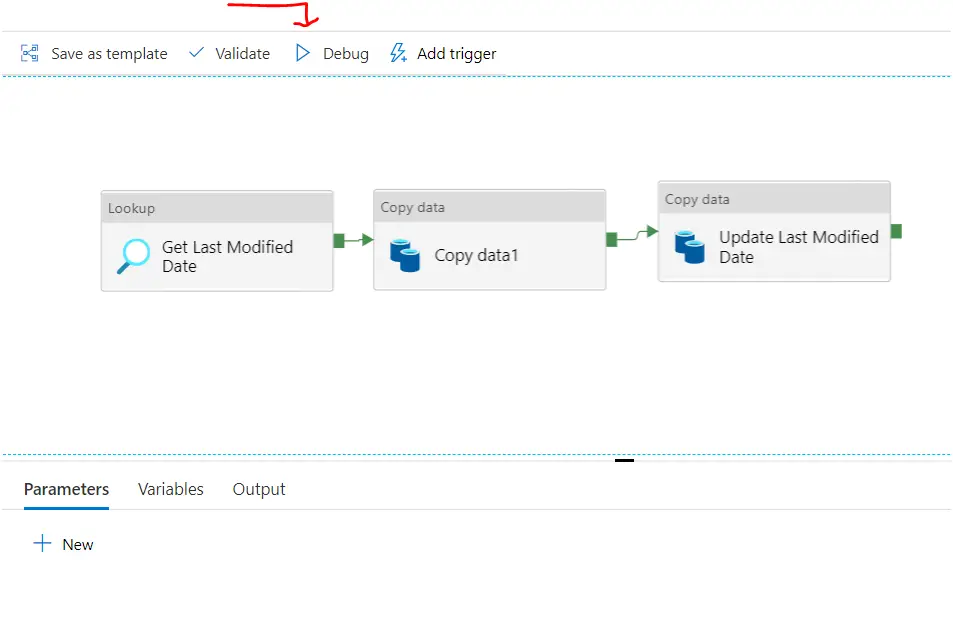
When you click on the Debug it will start running the pipeline like you are executing it. Its not testing. If you are doing deleting the data or inserting the data in your pipeline activity, it will get update respectively. Debugging the pipeline can make permanent change.
Warning : Do not consider the pipeline debugging just as testing it will impact immediately to your data based on the type of activity.
However you can use the ‘Preview‘ option available in some of the activity, that is available for the read purpose only.
For example you click on the any activity like lookup, copy (source side) and in bottom pane of setting you will the ‘Preview’ link like this :
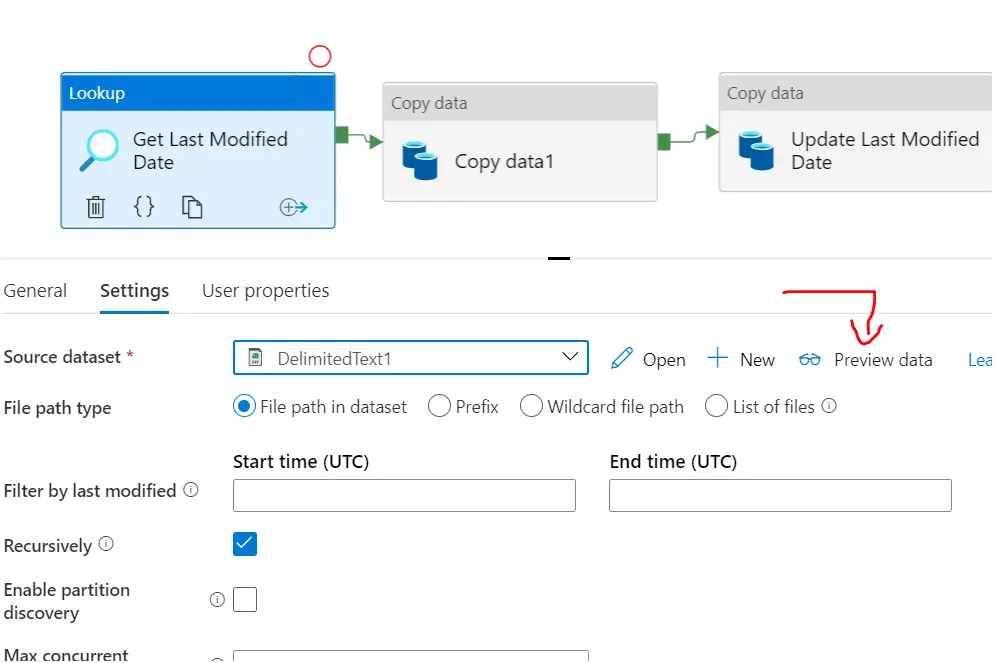
When you click on Preview Data you will the output as follows :
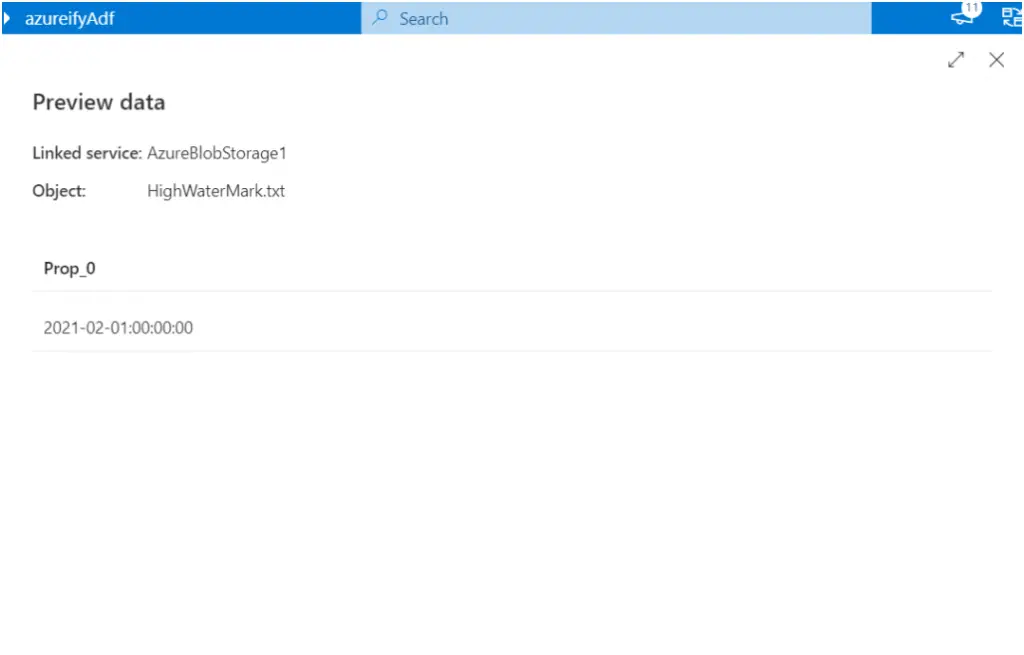
Preview is the safest way to see your logic is doing what you expect out of it.
Using Debug : There are two ways of the debugging.
- Debug entire pipeline.
- Debug part of the pipeline using the break points.
Debug entire pipeline :
For debugging the entire pipeline just click on the debug option available on the top pane. While you debug it will first ask you for the parameters (in case if your pipeline expecting any parameters.) Once you provided you can see the pipeline will get queued and as soon as get the integration runtime availability it will start running.
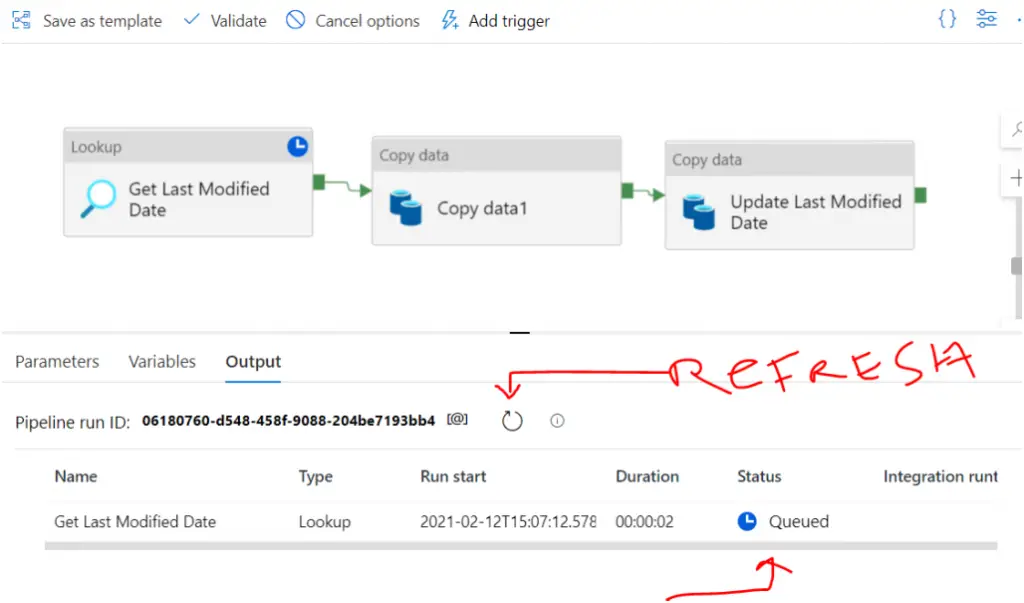
You can see the ‘Refresh’ icon , ADF automatically refresh in every 5 sec. It will show the result marked as green.
Once debug get successful you can see the output like this :
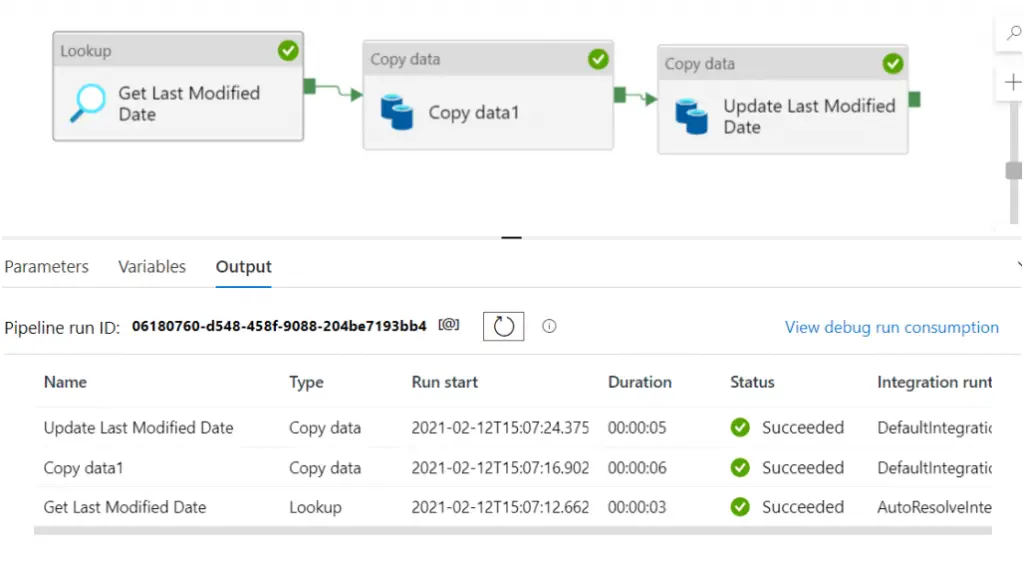
When you select any of the activity from below output, you see three icons :
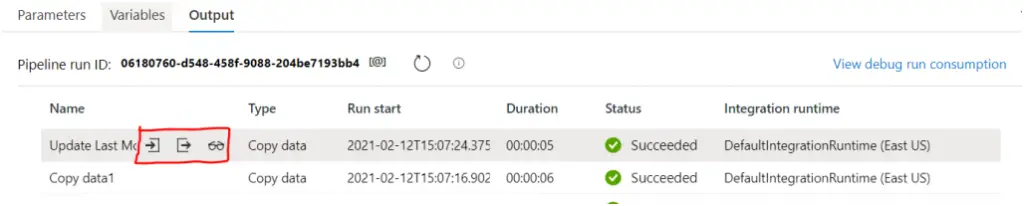
- For Input in json format.
- For Output in json format.
- View the output in little graphical form.
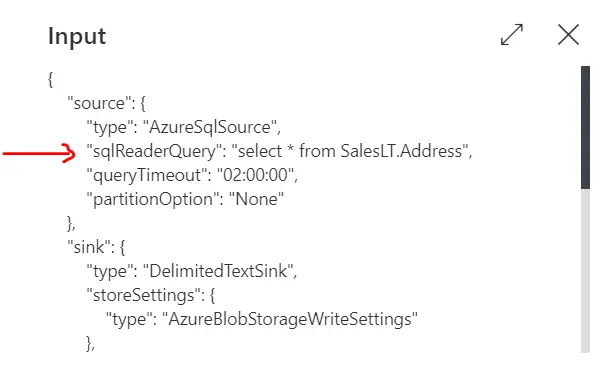
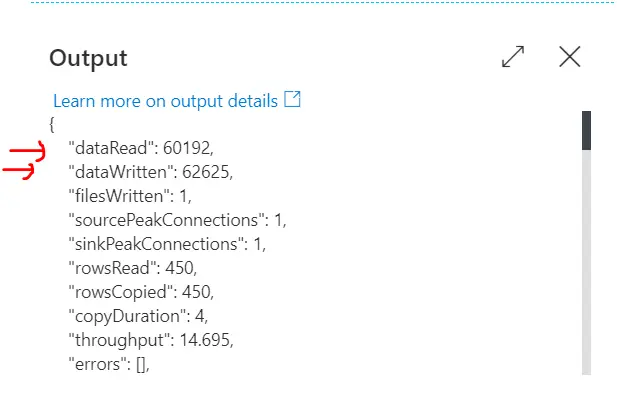
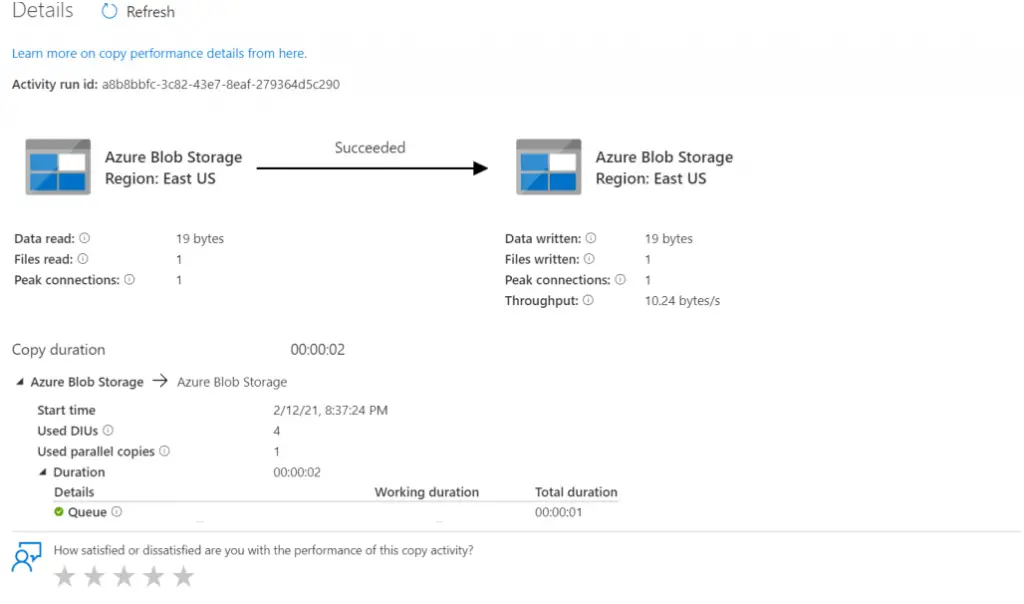
Example of input, output and view for copy activity copying data from SQL DB to blob looks like this :
Debug part of the pipeline using the break points : While doing if you want to check the pipeline up to certain activity you can do it by using the breakpoints.
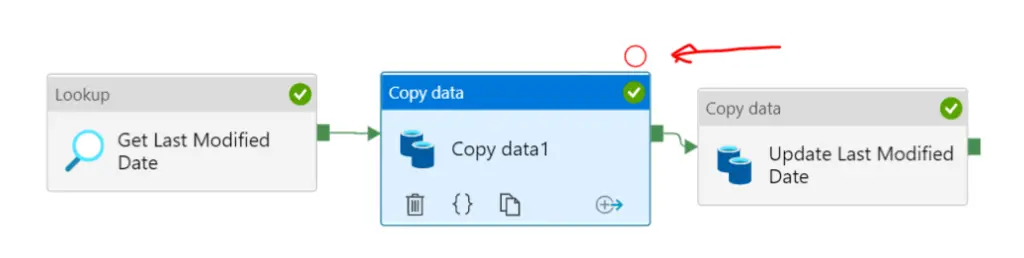
For example you have 3 activities in the pipeline and you want to debug up to 2nd activity only. You can do this by putting the break point at the 2nd activity. There is circle on the top of the activity you can just click to add break point :
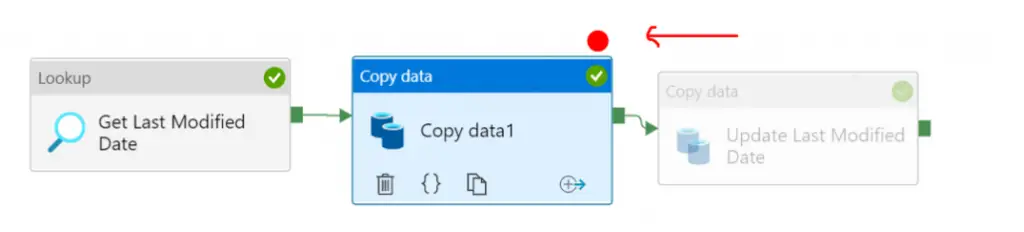
Once you click the hollow red circle you can see next activity will get disables and hollow circle converted to filled one :
Now if you debug the pipeline it will get executed up to breakpoint only.
There is no way to start the debug from the some middle of the chain. Activity will always start from the first activity, you can only limit upto what point you want it to run using breakpoint.
Summary : That is all about debug azure data factory pipeline, using the breakpoint and preview to further adding the arsenal into your azure data factory battle.
