
Are you looking to find the ways to monitor Azure Data Factory or may be looking for a professional way of alerting the Azure data factory whenever any pipeline fails or any activities get failed. In this article I will take you through the step by step process of configuring the logs for the Azure Data factory and we also go through how you can check whether the pipeline is running or not. It also talks about how to add alerts in the Azure Data Factory, How we can check the pipeline run history, what could be the best practices to configure Azure Data factory monitoring logs. Let’s get into each of these details step by step with the implementation.
Understand and explore Azure Data Factory Monitor Tab
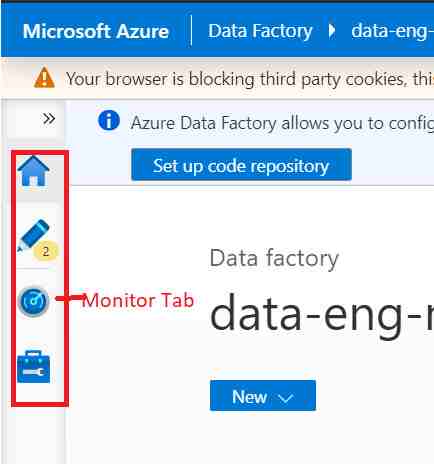
In the Azure Data Factory designer portal you will have four tabs named Home, Author, Monitor and Manage tab. You can see below in the screenshot.
Monitor tab of the Azure Data factory designer portal is the place where you need to go to monitor the Azure Data Factory. Once you get inside the monitor tab you will be greeted with the below screen.
Pipeline Run in Azure Data Factory Monitor
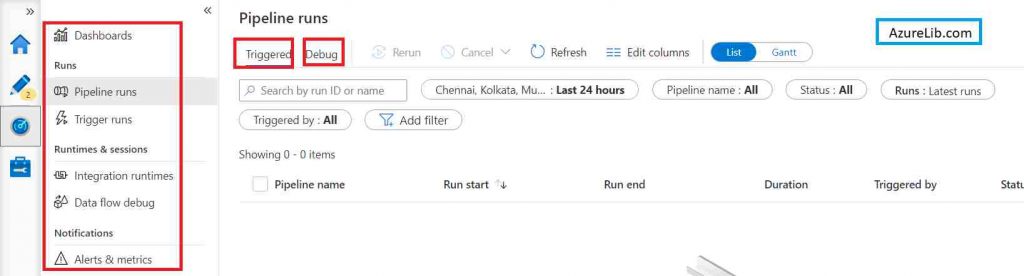
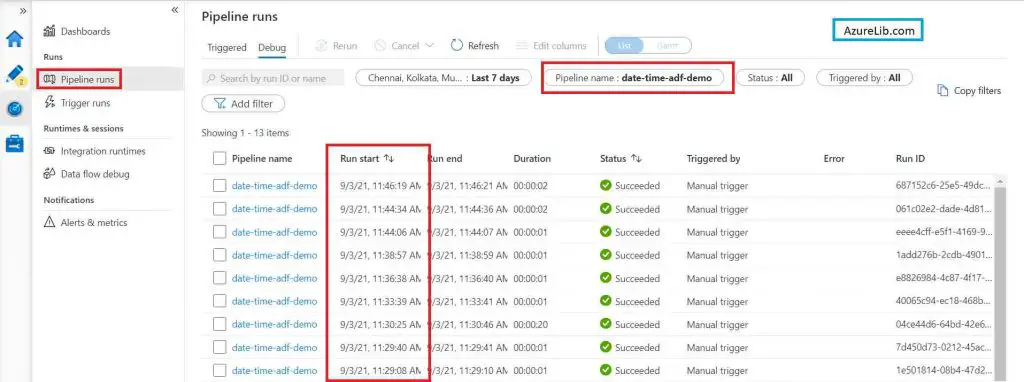
This is the default tab of the Azure Data factory monitor. Whatever be the pipeline that has been executed in your respective azure data factory account can be seen here. Here you have the filter available using which you can filter the pipeline run which you want to monitor. You can filter based on pipeline name, execution time, triggered by and many other filter criteria.
There is an option to sort the result based on the date time as well. You can click on the column name to sort the records in specific order.
Pipeline Run Debug Tab
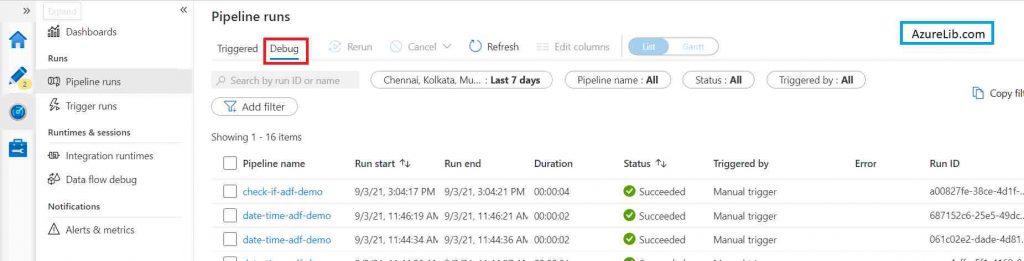
In the pipeline run there are two tabs at the top of the page. One is for the Triggered and other is for the Debug. By default all the pipeline run display is for the execution initiated by the Triggers. In case if you want to see all the pipeline execution when you manually click the debug to run the pipeline, then you can see the logs for all the debug runs by clicking the debug tab in this same window.
Pipeline Run- Refresh
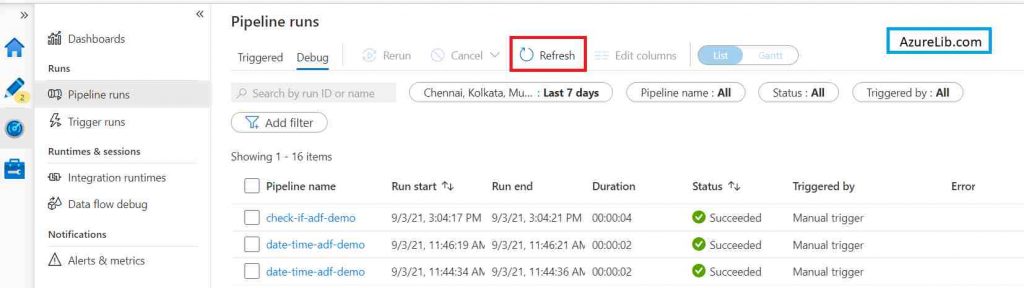
Sometimes when you are monitoring the live running pipeline then to see the updated status of those pipelines you can use the refresh functionality by clicking on the refresh button. This will refresh the pipeline status and list based on the criteria selected. There is no need to refresh the entire page.
Trigger Run in Azure Data Factory Monitor
Trigger run tab is exclusively for checking the pipeline execution status for a specific trigger and type of trigger. Here let’s say for example if you have different types of triggers available in your data factory like schedule, tumbling window, storage event trigger and you want to see the pipeline execution counts based on that trigger, then you can check the status here.
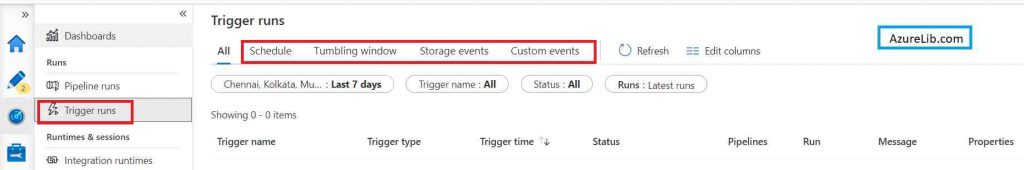
Schedule Tab
This will display all the scheduled types of trigger and pipeline run count for it.
Tumbling window Tab
This will display all the tumbling window types of trigger and pipeline run count for it.
Storage Events Tab
This will display all the storage events types of trigger and pipeline run count for it.
Custom Events Tab
This will display all the custom events types of trigger and pipeline run count for it.
All Tab
This will display all the types of trigger and pipeline run count for it. This is the default selected option which is enabled.
Integration Runtimes in Azure Data Factory Monitor
In this tab of the integration runtime of Azure Data factory monitor you can check the list of all the integration runtimes available with their current status. Sometimes your pipeline fails because of the integration runtime and in those cases if you wanted to see the integration runtime status you can come to this page to see the detailed statuses.
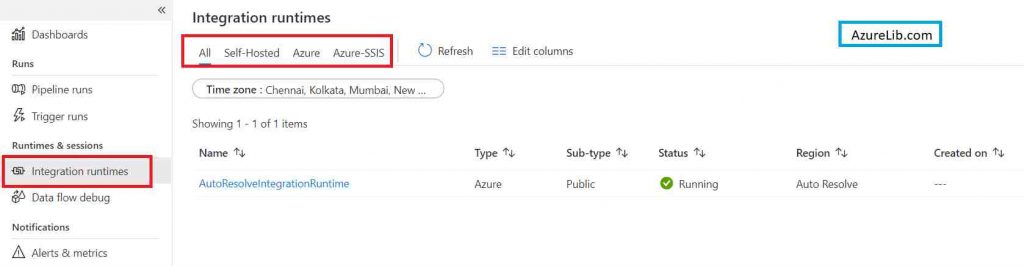
Self-Hosted IR Tab
This will display all the self hosted integration runtime associated with your Azure Data factory account. You can check which of them are running and which are stopped running and failing.
Azure IR Tab
This will display all the azure autoresolve integration runtime associated with your Azure Data factory account. You can check which of them are running and which are stopped running and failing.
Azure-SSIS IR Tab
This will display all the azure-ssis integration runtime associated with your Azure Data factory account. You can check which of them are running and which are stopped running and failing.
All Tab
This will display all the types of the integration runtime associated with your Azure Data factory account. You can check which of them are running and which are stopped running and failing.
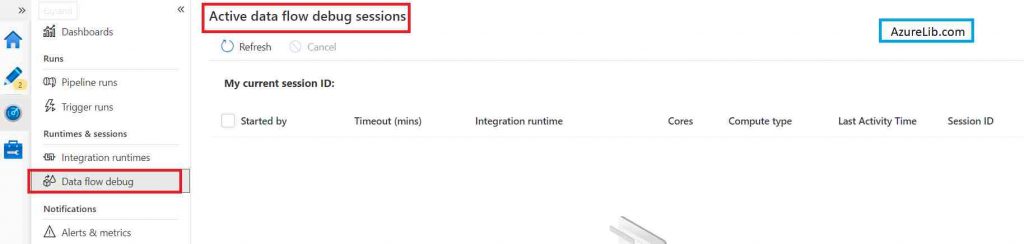
Data Flow Debug Session in Azure Data Factory Monitor
In this tab of Azure Data factory monitor you can check list of all the data flow debug sessions which are active. You can monitor the various information like when it gets started, who has started, what is the size of the cluster, session id and a couple of other details.
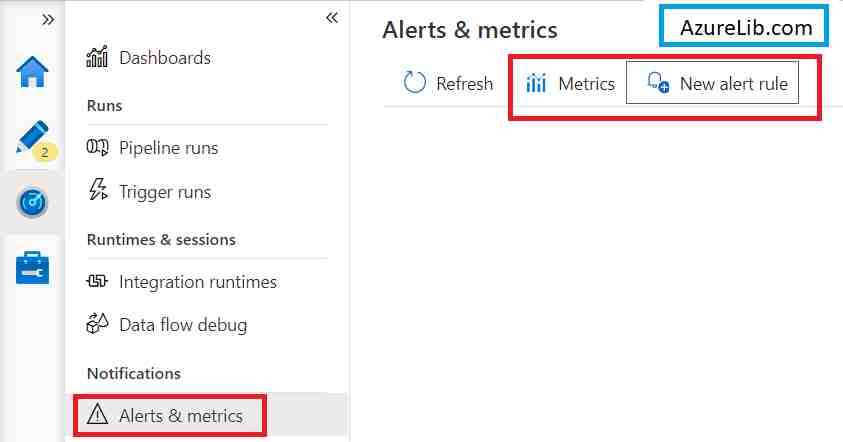
Alerts and metrics in Azure Data Factory Monitor
In this tab of Azure Data factory monitor you can check metrics of Azure Data factory like how many times a pipeline failed, how many pipelines failed etc. You can also create the data factory alerts based on various criteria. For example you can set alerts to get notified of any pipeline failure.
How to check Azure Data Factory pipeline run history
In the ADF you come across the situation in the real world day to day scenario where you will need to know how to check the pipeline execution history on a frequent basis. For instance I have scheduled the pipeline to run in some intervals hence over a period of time, the pipeline will get executed many times and I may want to see the status of all these historical runs. I can check the history by following these steps as follows:
Step 1: Go to the Azure Data factory monitor tab.
Step 2: In the filter tab select the pipeline name for which you want to see the history.
Step 3: Select the time duration for which you want to see the history of the pipeline.
Step 4: Now you will be able to see all the execution run summary for specific pipelines.
Step 5: Select the specific run execution from the history, just click on it you will be able to see the details of this run with all the activities input and output detail. In case if this pipeline has failed then you will be able to see the error log as well.
How to check if pipeline is running in Azure Data Factory
In the ADF you come across the situation in the real world day to day scenario where you will need to check if a pipeline is currently running or failed or succeeded. Sometimes you schedule the pipeline to run once some specific event gets triggered or scheduled time arrives, in those cases you want to go and check if the pipeline started running or not. In these scenarios you can use the Azure Data factory monitor tab where you can find whether the pipeline is running or not. You follow these steps to identify azure data factory to check if pipeline is running:
Step 1: Go to the Azure Data factory monitor tab.
Step 2: In the filter tab select the pipeline name for which you want to see the history.
Step 3: Select the time duration for which you want to see the history of the pipeline.
Step 4: Now you will be able to see all the execution run summary for specific pipelines.
Step 5: Sort it by the last run date and there you will see if the pipeline is still running or it failed or completed. In case if the pipeline doesn’t yet start then you will see last run status.
If you have clicked on debug pipeline and then you want to check if pipeline is running or not then you can follow above steps and instead of seeing in the triggered tab select the ‘Debug’ tab search pipeline in it.
How to configure Azure Data Factory Monitoring Alerts
Alerts are the notification which you want to set in case of any specific conditions reached. For example I wanted to get an email alert or SMS alert whenever any activity failed or else I wanted to get the notification as soon as the pipeline successfully completed. My alert notification criteria could be anything based on my client’s business needs. Let’s go through the step by step process on how we can set the adf monitoring alerts.
Step 1: Go to the monitor tab of the Azure Data factory account.
Step 2: Select the alerts and metrics tabs under the notification tab.
Step 3: Click on the ‘New Alert Rule’ to create new alerts.
Step 4: Enter the valid Alert rule name, Description and Severity.
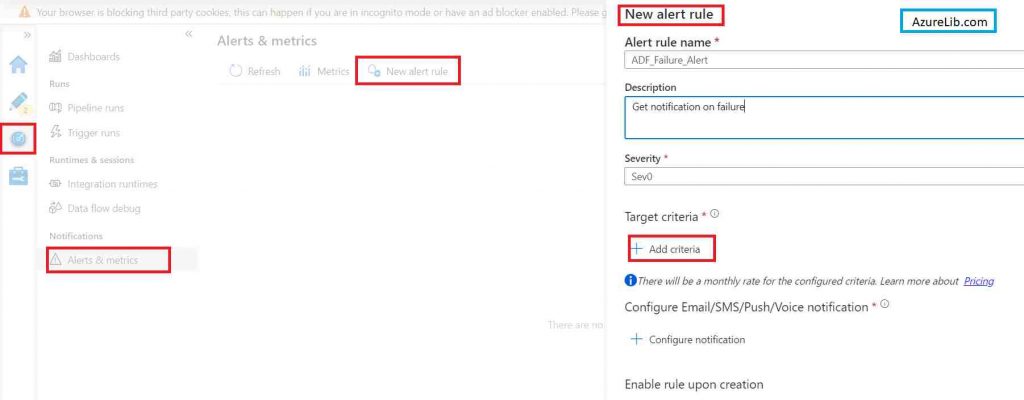
Step 5: Click on Add Criteria to add the conditional predicate for the notification.
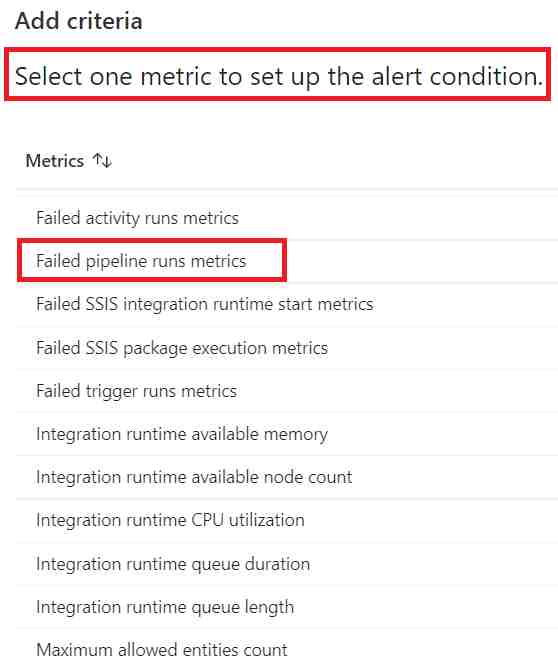
Step 6: Now here you have selected the metric for which you want to generate the notification. For example if I want to generate the alert for any specific pipeline failure let’s select the failure pipeline as the metric.
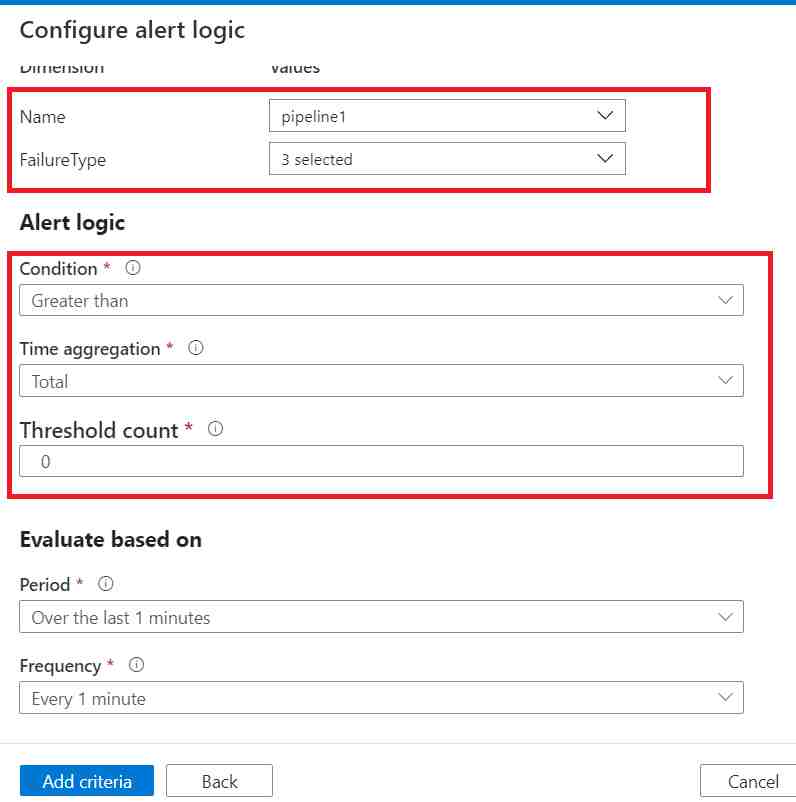
Step 7: Select pipeline name. For example I have selected ‘pipeline1’. Add alert logic like we want to generate the alert when failure count is greater than 0. Select the ‘Evaluate based on‘ configure, it is the time period after which these conditions will be evaluated. Click on Add criteria. This will add the criteria. If you want you can add more criteria in the same alert.
Step 8: Configure notification, in this you can select the action group, a group which will get notified when your alert criteria is reached. Then click on Add notification. Select Email or SMS as per the need and then provide the email id or SMS respectively. Click on Add notification.
Now that’s how you have successfully created Azure Data Factory Alerts.
In case you are looking for the Microsoft official Docs of Azure Data factory Monitor logs you can find here : Link
Azure Data Factory monitoring Best practices
- As best practice for the Azure Data factory monitoring, log needs to be captured systematically. By default Azure kept the logs for pipeline run maximum up to 45 days. Hence after 45 days your adf logs will not be accessible thereafter.
- Configure your diagnostic logs to a storage account for auditing or manual inspection. You can use the diagnostic settings to specify the retention time in days.
- You should configure the log analytics workspace to analyze the logs using the queries.
- Add the Azure Data factory Monitoring service pack from the Azure Marketplace. It will provide a one click monitoring solution across the data factories. It has a built-in dashboard as well for quick access to adf log metrics.
Recommendations
Most of the Azure Data engineer finds it little difficult to understand the real world scenarios from the Azure Data engineer’s perspective and faces challenges in designing the complete Enterprise solution for it. Hence I would recommend you to go through these links to have some better understanding of the Azure Data factory.
Azure Data Engineer Real World scenarios
Azure Databricks Spark Tutorial for beginner to advance level
Latest Azure DevOps Interview Questions and Answers
You can also checkout and pinned this great Youtube channel for learning Azure Free by industry experts
Final Thoughts
This is all about the Azure Data factory monitor logs. In this article we have learned and explored the Azure Data Factory monitoring portal. I have also taken you through the creation of Azure Data Factory alerts and configuring the diagnostic logs. We have also seen how to check the pipeline run history in adf and how to check if a pipeline is running or not.
That’s all for now guys, if you are reading up to this point, I assume you would have liked it and learned the ADF monitoring concepts.
Please share your comments, suggestions and feedback in the comment section below.
